
Algorithmic Overlap Estimations (Part 1)
How quickly can we determine if individuals in set A are also in set B, C, or D?
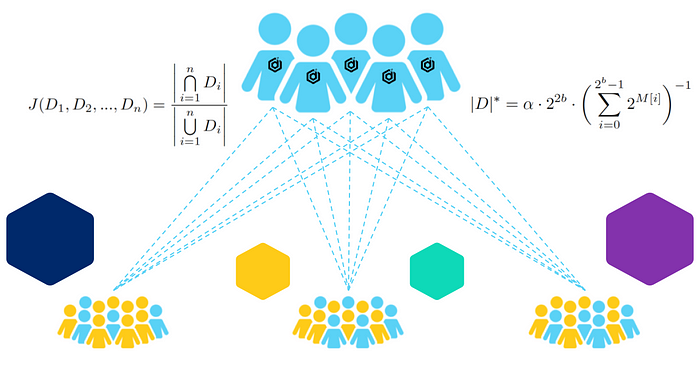
This is the first of a two-part post discussing some of the research behind our recently launched Datavant Trials, a web-based trial tokenization solution that helps bridge the gap between clinical trials and real-world data (RWD) to accelerate research-grade evidence generation. In this post, we outline our interest in and approaches to computing overlap between datasets that play a significant role in our trial tokenization product. In Part 2, we offer some hypotheses about how the algorithms might perform on a variety of datasets, as well as our observations from testing.
Let’s say a hypothetical group of cancer researchers at Yale would like to study the effects of a novel immuno-oncology treatment in a post-approval study. They aim to find out whether the new treatment is effective, as measured by an increased overall survival, and whether the treatment’s side effects are impacted by other drugs prescribed to these patients.
To answer those questions, the researchers would like to know how many individuals in this study are having prescriptions filled at Walgreens and how many of those individuals are using a more specialized pharmaceutical provider, like Onco360. Then they would like to compare this with U.S. mortality data, and then also filter their results, perhaps by geographical region and patient age. If there is a high volume of overlap, it may be desirable for the researchers to augment their data by combining datasets. This is a fictional scenario, but very much in line with the kind of work Datavant Trials aims to facilitate by connecting real-world data with clinical trial data. These specific names are here representative of “an academic group” (Yale), and “two prescription datasets,” one small (Onco360), and one large (Walgreens).
The central problems of computing overlap
Because these entities are all part of the Datavant ecosystem, we have the ability to inform the researchers of the precise overlap between these four datasets, but this scenario presents two problems:
- Running this query takes too long for the user to run in-browser (which is how more simple overlaps are performed).
- A user may want to perform several filtering operations in quick succession, so we also need to be able to filter the datasets and calculate overlap on subsets of each dataset.¹
Rather than waiting for a slow query and risking a browser time-out for the user making the request, we can perform the precise computation of the full datasets in the background and deliver the results a few minutes later. This solves our first problem, but is not ideal if the user needs to perform subsequent computations.
We wanted to see if we could offer a better user experience by way of sketch data structures.
What’s a sketch data structure?
A sketch data structure is exactly what it sounds like: a summary or “sketch” of the full data that is a compact representation of it. As with other forms of compression (image, audio, or video compression), creating a representative sketch of a dataset involves trading off fidelity for efficiency:
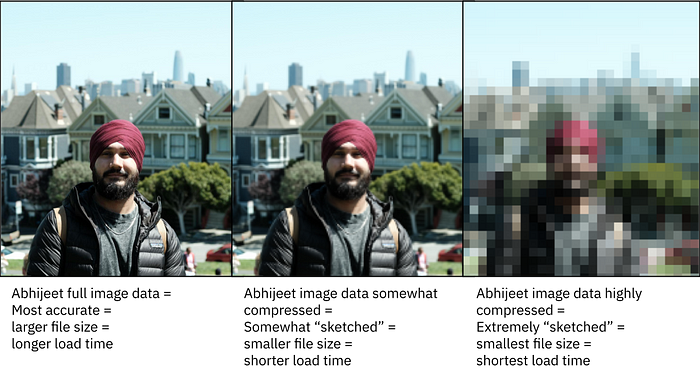
If we were interested in knowing something about atmospheric conditions on a particular day in San Francisco, then the image on the right would provide enough information for us to know if further investigation is warranted. An analogous representation of a full dataset can be useful for providing quick (essentially real-time) exploratory feedback on large datasets if absolute precision is not necessary at that stage of inquiry. The researcher requesting the computation could then decide based on the estimation if it was worth filtering data in another way and/or running the full overlap computation.
Dataset size
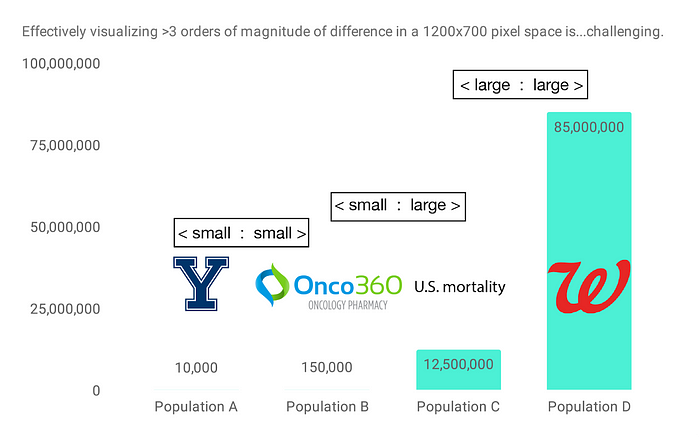
Returning to the datasets in our concocted scenario at the top of the post, let’s say we have 12.5 million mortality records, Onco360 is filling prescriptions for 150,000 individuals, and our hypothetical Yale study includes 10,000 participants. Walgreens has 85 million active MyWalgreens members. By clinical trial standards, this study would be on the larger side, but compared to the number of people having prescriptions filled at Walgreens, 10,000 individuals is quite a small number:
In other words, in order to perform many pairwise overlaps between these datasets, we need to be able to handle 3 types of cases:
- a small dataset and another small dataset, <small:small>
- a large dataset and another large dataset, <large:large>
- a large dataset and a small dataset, <large:small>
Evaluating algorithmic sketch data structures
We had 2 primary evaluation criteria:
- We were looking for <10% error on estimation vs. actual count of intersections.
- Relative order of errors should be correct.
I.e., if the actual count of intersections is 2,500, our estimation should return a result between 2,251 and 2,749 to be within an acceptable margin of error. And, if the estimated overlap of Yale to Onco360 is 1,000 and the estimated overlap of Yale to Walgreens is 850 (Overlap of A to B > Overlap of A to C) then this relationship should be true in the exact data as well.
We also had other specific questions to answer about the algorithms:
- Are estimates < 20% for all size & true overlap scenarios?
- Do estimates bias towards overestimating or underestimating overlap amount?
Our preference is for overestimates.
Establishing a Baseline: Token based sampling (TBS)
Datavant uses a set of tokens that serve as de-identified patient data. A token could include a variety of combinations of personally identifiable information (PII), such as:
Last Name + 1st initial of First Name + Gender + DOB.
All tokens are length 44 base64 encoded strings.
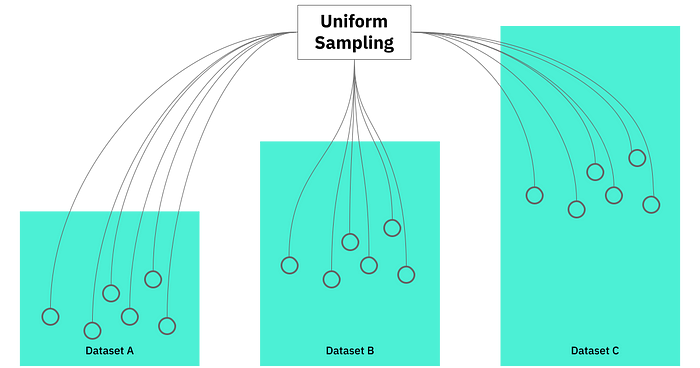
Because this is one of our core technologies, we used token based sampling as a baseline of comparison for sketch data structures. Intended to be the simplest approach, we sample tokens uniformly from each dataset and compare them for overlap. Theoretically, we could do this in real-time and use the result to extrapolate to the full dataset.
How token based sampling works
Assuming the token distribution is relatively uniform (and in fact, it does generally seem to be), we use the following approach to generate random subsets, which act as a proxy for the full datasets:
- For each ingested dataset, we store a separate subset of the dataset by looking at distinct token values and filtering to keep the ones that have q leading 0’s. The approximate fractional size of this subset would be:

- To run overlaps, we compute true overlaps on these pre-prepared subsets and extrapolate to the full dataset size given the factor by which the down-samples are produced.
- Depending on the dataset size, q can be increased to make the samples smaller.
For testing purposes, we considered two versions of token based sampling that differ on how the sample size is determined and how the intersection cardinality is extrapolated.
Note for the following equations:
n( . ) refers to the exact count of tokens (number of records) in the dataset
| . | refers to the exact count of distinct tokens (number of individuals)
| . |* refers to the estimated count of distinct tokens (number of individuals)
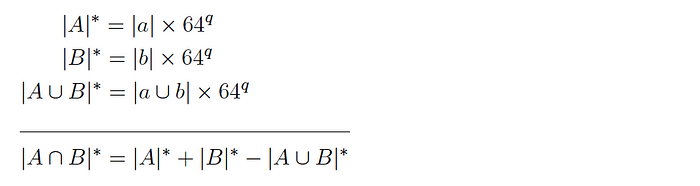
Version 1: for two datasets A and B and corresponding subsets a and b, it is expected that:
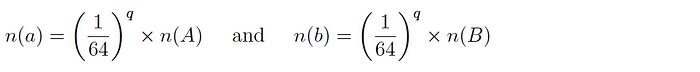
and so the intersection cardinality is computed as follows:
Version 2: for two datasets A and B and corresponding subsets a and b, it is expected that:

and so the intersection cardinality is computed as follows:
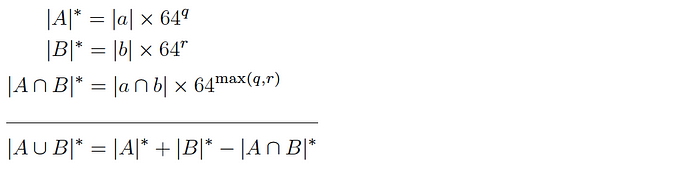
Since this version allows q and r to be different, it can be used to produce similarly sized samples even if there is a large difference in size of the corresponding base datasets.
As a benchmark, token based sampling generally yielded 2—3% error, well within our desired <10% error threshold. The problem was that we noticed that it was inconsistent, sometimes returning results at 60% error.
Algorithmic approaches
We investigated four algorithmic approaches for computing overlap. HyperLogLog, HyperMinHash, Bloom filters (slow and fast), and Theta Sketches. Theta Sketches failed catastrophically in extreme cases of <large:small>, exhibited the highest variability (and highest median error) in relative intersection errors when evaluated on randomly generated subsets, and demanded the highest memory usage. Considering those observations, we’re not including Theta Sketches in the rest of this discussion.
HyperLogLog (HLL)
HyperLogLog involves computing a base array M of length 2ᵇ for each dataset. The base array is populated by hashing each element in the dataset to a binary number that is split into two components:
- The first b bits of the bit pattern are used to index the array M.
- The remaining bits are used to determine the position of the leftmost ‘1’ (e.g. for a bit pattern ‘001100’, the leftmost ‘1’ is in position 3). This value is what is stored at the index computed in (1).
Given a populated base array M, the cardinality of the corresponding dataset D is estimated as follows:
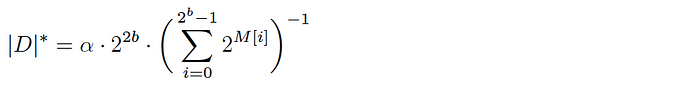
where α is a normalization constant to account for hash collisions.
Dataset unions are translated to the HLL-plane easily by taking the element-wise max of the base arrays corresponding to the datasets. (The formula above can be applied to the resulting array to yield an estimate of the cardinality of the union of the target datasets.) And as shown previously in the discussion of TBS, if we can estimate the cardinality of each individual dataset and the union of these datasets with their corresponding HLL arrays, we can compute the intersection cardinality (overlap) estimate via the inclusion-exclusion principle.
HyperMinHash (HMH)
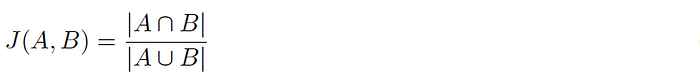
HyperMinHash involves estimating the Jaccard Index (the similarity between datasets). For a pair of datasets A & B, the Jaccard Index is computed as follows:
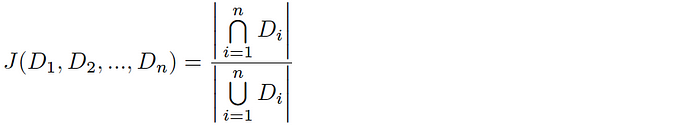
and likewise, for n-way intersections this equation is extended as follows:
Assuming we have a uniform hash function h(Dáµ¢), you can say that the káµ—Ê° smallest hash values represent a random sample of the total space of possible hash values for this dataset (and likewise, the káµ—Ê° smallest values across all hashed Dáµ¢ is a random sample of the global hash space). Given a total tally of elements hashing to the káµ—Ê° smallest hash values y, the Jaccard index is estimated as follows:

And thus, combining with HLL, we get an estimate of the cardinality of the intersection of the sets as follows:

Bloom Filters (BF)
A Bloom filter is a probabilistic data structure used to determine whether a particular element is a member of a given set. You can read more about the fundamentals of Bloom filters in our post comparing the relative advantages of Bloom filters and tokenization. Even though this is a slightly different application of the Bloom filter than outlined in the linked post, the underlying principles remain the same. Here, we experimented with both slow and fast Bloom filters.
- BF-slow involves looping over all of the token values in the smaller dataset being compared, and for each checking for its membership in the Bloom filter of the larger dataset. The algorithmic complexity of this is O(min(n(A), n(B)) where n(A) & n(B) are the lengths of the datasets-to-be-overlapped A & B.
- BF-fast: In the case where the Bloom filters corresponding to the datasets-to-be-overlapped are the exact same length L, we can use estimation equations that require element-wise operations between the two Bloom filters. The algorithmic complexity of this is O(L).
That’s our Part 1 introduction to the algorithmic overlap estimations we investigated. In Part 2 of this post, we offer our hypotheses about their performance and explore the results of our investigation.
References
[1] Datavant’s mission to connect the world’s health data to improve patient outcomes necessarily implies that we must contend with the risk that de-identified data could be re-identified when combined with other datasets. Privacy preservation is a primary focus for the company, and would be a central problem here if this were a real world scenario. This article is only focused on overlap computation strategies, but you can read more about Privacy Hub by Datavant.
Algorithm Implementations/Libraries
We tested using the off-the-shelf implementations below.
BF-fast & TBS (v1 & v2) were implemented manually.
HLL: python-hll (Python)
HMH
- hyperminhash (Python)
- py-hyperminhash (Python)
- hyperminhash (GO)
BF: python-bloomfilter (Python)
See also:
https://schibsted.com/blog/1732486-2/
https://tech.nextroll.com/blog/data/2013/07/10/hll-minhash.html
https://towardsdatascience.com/big-data-with-sketchy-structures-part-2-hyperloglog-and-bloom-filters-73b1c4a2e6ad
About the Authors
Authored by Abhijeet Jagdev and Nicholas DeMaison, with significant input from Aneesh Kulkarni, Jonah Leshin, Vera Mucaj, and Su Huang.
Considering joining the Datavant team? Check out our careers page and see us listed on the 2022 Forbes top startup employers in America. We’re currently hiring remotely across teams and would love to speak with any new potential Datvanters who are nice, smart, and get things done, and who want to build the future tools for securely connecting health data and improving patient outcomes.

